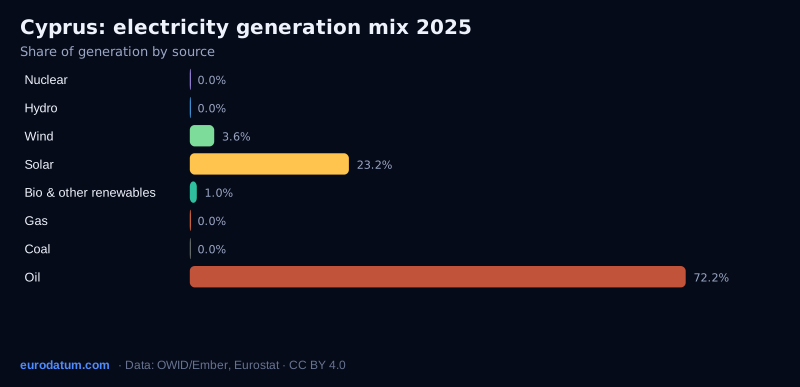
In 2025, Cyprus generated 5.9 TWh of electricity and used 5.9 TWh. Oil was the largest source at 72% of generation.
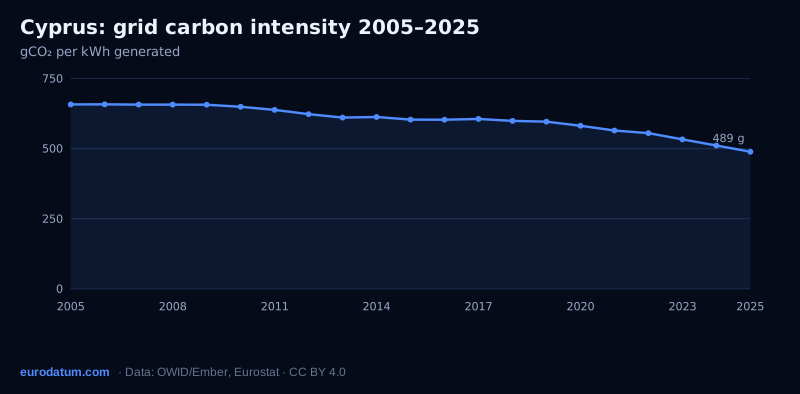
489gCO₂/kWh grid intensity#29 of 30 · EU 210
28%low-carbon electricityEU 71%
0.217€/kWh industrial, 2026 H1#28 cheapest · EU 0.135
190€m/yr power for 100 MW AI campus428 kt CO₂/yr
28% of its electricity came from low-carbon sources (nuclear and renewables), below the EU-27 average of 71%. Grid carbon intensity was 489 gCO₂/kWh, ranking #29 of 30 European countries (1 = cleanest), down 19% since 2015. Industrial users consuming 20–70 GWh a year paid €0.217/kWhexcluding VAT in 2026 H1, more than the EU-27 average of €0.135 (#28 cheapest of 28). At €0.217/kWh, a 100 MWAI data center running at full load (876 GWh a year) would pay about €190 million a year for electricity and, on the average grid mix, be responsible for about 428 kt of CO₂.
Electricity generation mix, 2025
Source
Cyprus
EU-27
Nuclear
0.0%
23.3%
Hydro
0.0%
11.7%
Wind
3.6%
17.1%
Solar
23.2%
13.1%
Bio & other renewables
1.0%
5.8%
Gas
0.0%
16.7%
Coal
0.0%
9.2%
Oil
72.2%
3.1%
Grid carbon intensity, 2005–2025
gCO₂ per kWh of electricity generated. Lower is cleaner.
Wind and solar share of generation
Industrial electricity price, 2019–2026 H1
Non-household consumers using 20–70 GWh/yr, excluding VAT and recoverable taxes, €/kWh.
Infrastructure & market
2colocation facilities (PeeringDB)
9data centers mapped in OpenStreetMap
–HV substations (pending)
1,000MW cross-border capacity, 2030 grid (TYNDP)
–wholesale price (no single zone)
–negative-price hours
786cooling degree days (5-yr avg)
1,440kWh/kWp solar yield at the capital (PVGIS)
Cyprus has 2 colocation facilities listed in PeeringDB. The TYNDP 2030 starting grid gives it about 1,000 MW of cross-border transmission capacity. Its climate averaged 786 cooling degree days a year (Eurostat), a rough guide to how hard data center cooling has to work.
 Country power profile · CY